🎯 Key Features
1. Real-Time Stock Analysis
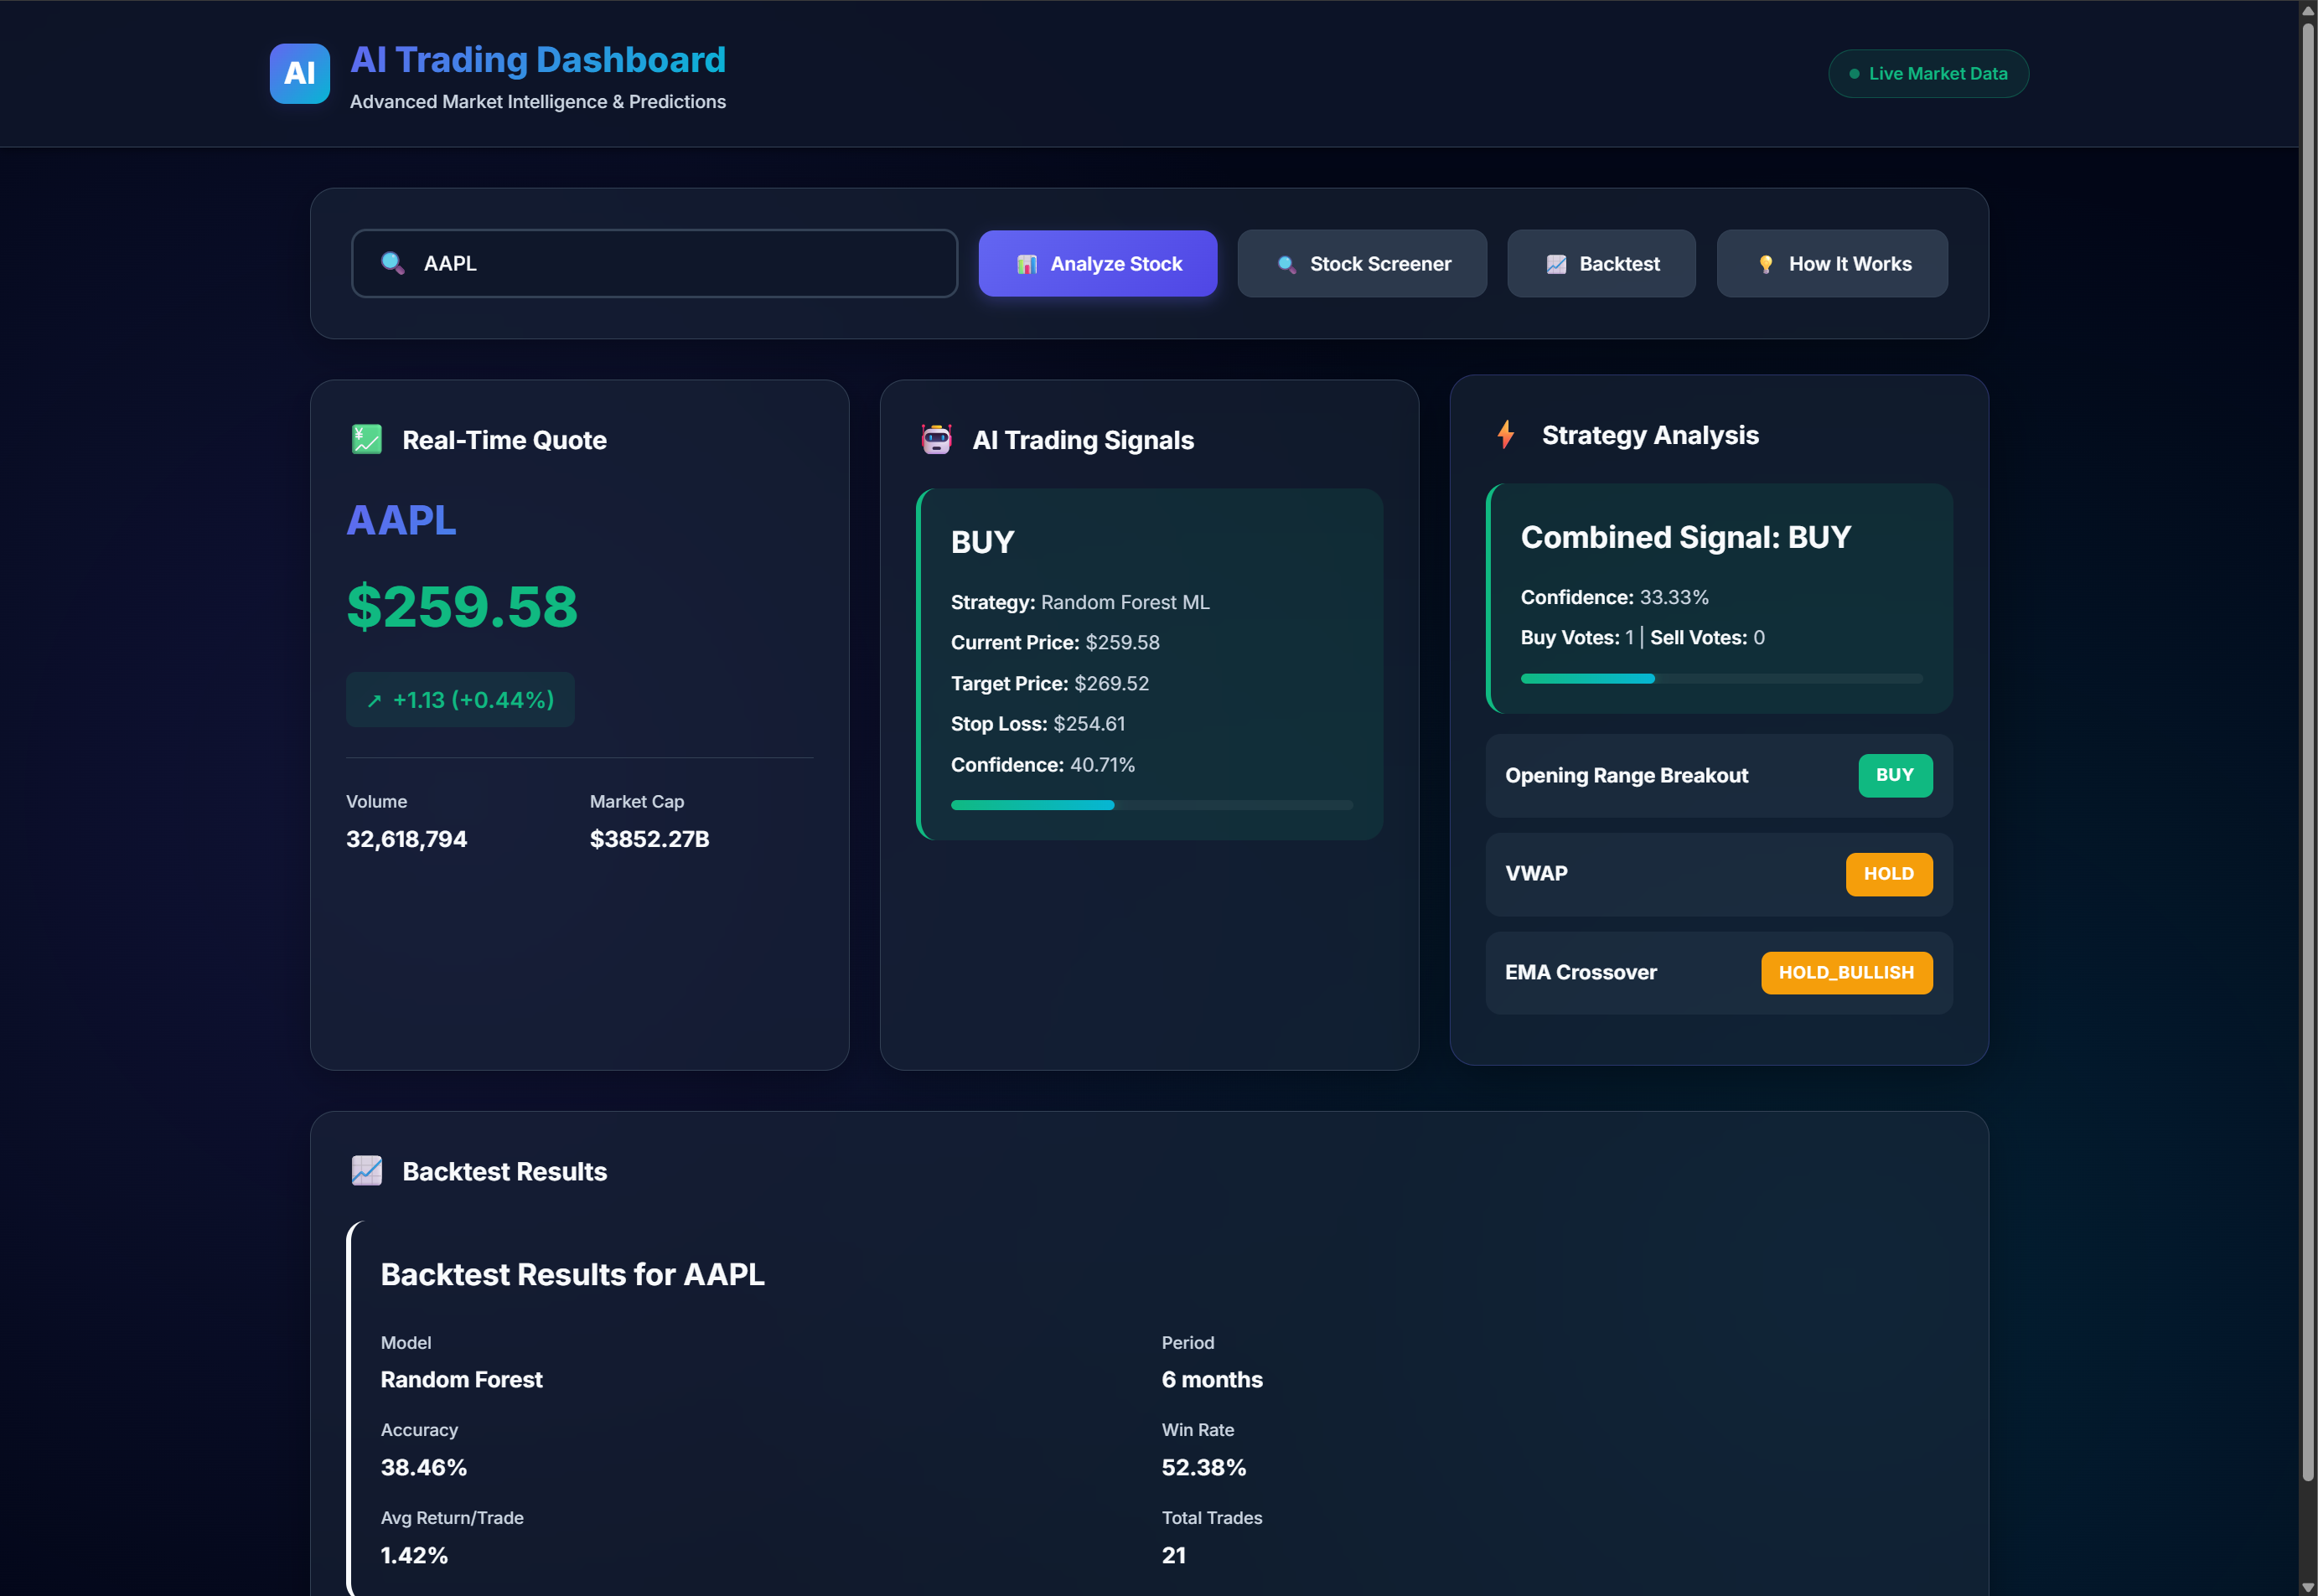
- Live stock quotes with current price, change %, volume, and market cap
- Interactive price charts using yfinance historical data
- Real-time market data updates via Yahoo Finance API
2. AI-Powered Predictions AI thoughts
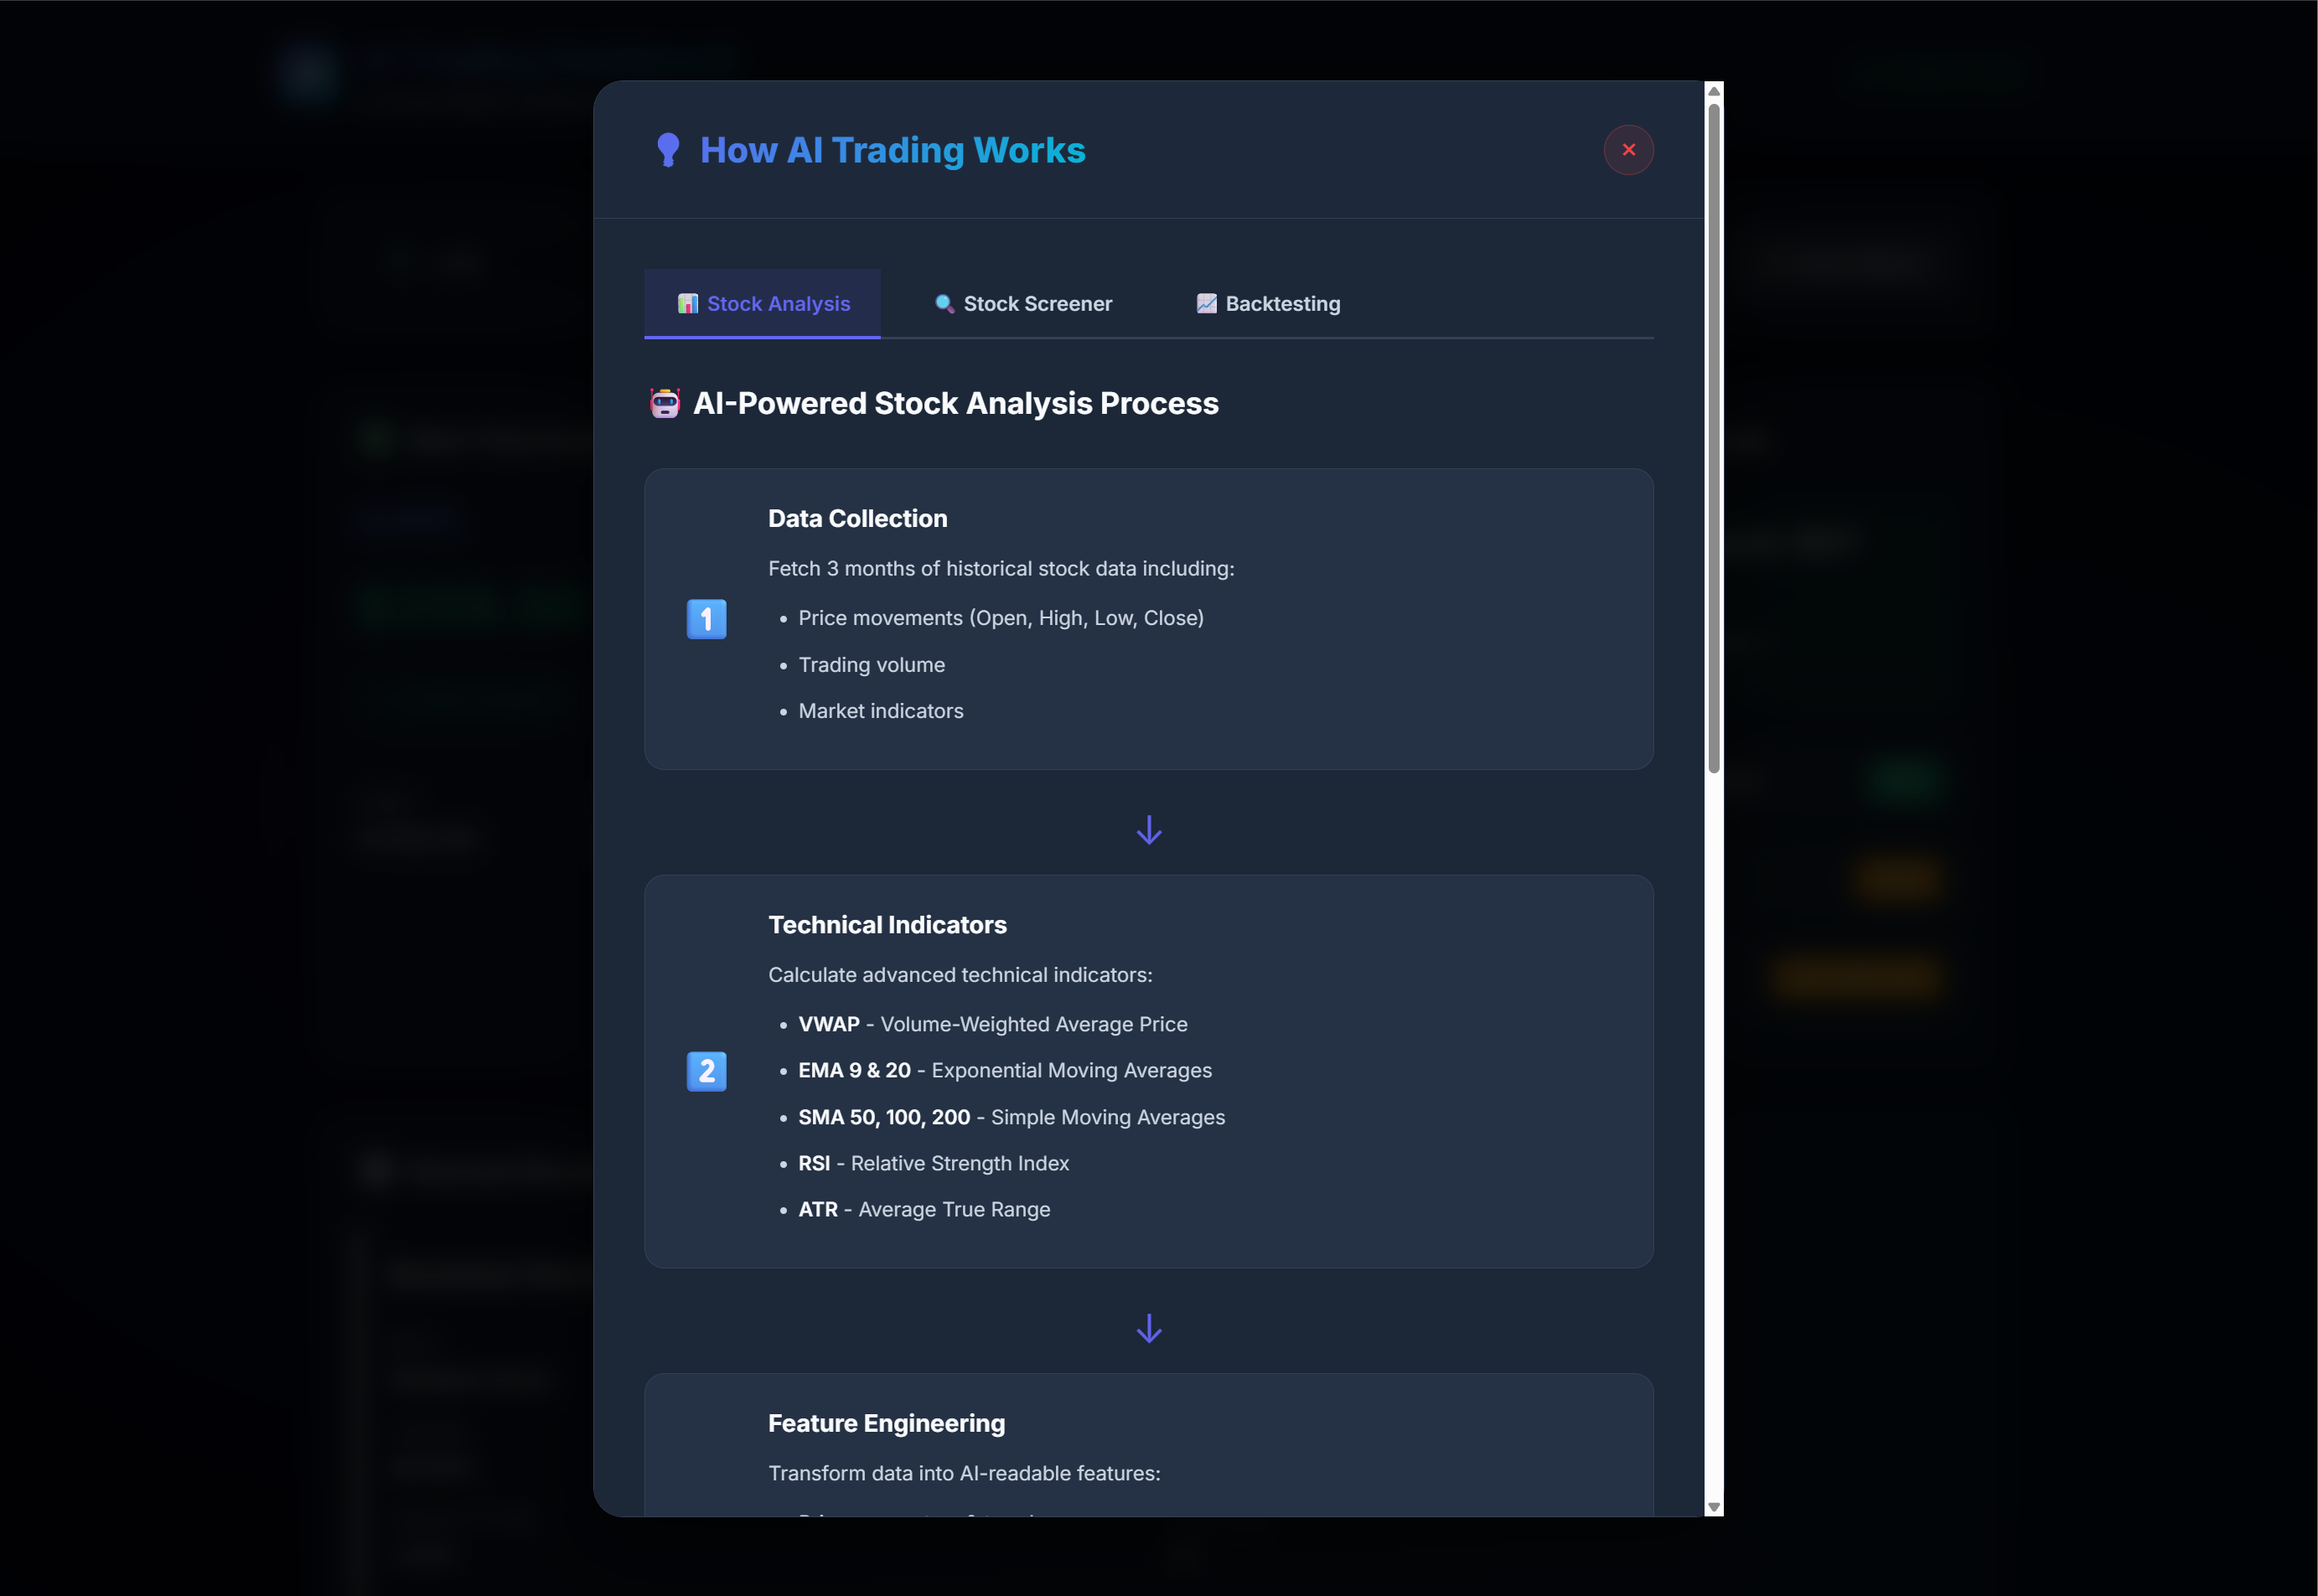
Uses a Random Forest Machine Learning model trained on:
- 6 months of historical stock data
- 50+ technical indicators (RSI, MACD, EMA, Bollinger Bands, etc.)
- Price patterns and volume analysis
Model Output:
- Signal Type: BUY, SELL, or HOLD
- Current Price: Live market price
- Predicted/Target Price: AI's price prediction
- Safety Exit/Stop Loss: Automatic risk management level
- Confidence Score: Model certainty (0-100%)
- Recommendation: Based on confidence thresholds
Confidence Logic:
- ≥60%: "Proceed with good confidence"
- 40-59%: "Proceed with caution"
- <40%: "WAIT for higher confidence"
3. Industry Thoughts (Strategy Analysis) ⚡ Industry thoughts
Combines signals from 3 proven trading strategies:
a) Opening Range Breakout (ORB)
- Analyzes first 15 minutes of trading
- Detects breakout above/below opening range
- Signal: BUY (breakout up), SELL (breakout down), HOLD (no breakout)
b) VWAP Strategy
- Volume-Weighted Average Price analysis
- Compares current price to VWAP
- Signal: BUY (above VWAP), SELL (below VWAP), HOLD (near VWAP)
c) EMA Crossover
- Uses 9-day and 20-day Exponential Moving Averages
- Golden Cross (9 EMA crosses above 20 EMA) = BUY
- Death Cross (9 EMA crosses below 20 EMA) = SELL
- No crossover = HOLD
Combined Voting System:
- Tallies votes: Buy, Sell, Wait
- Final signal based on majority
- Confidence = % of strategies agreeing
- Displays individual strategy votes
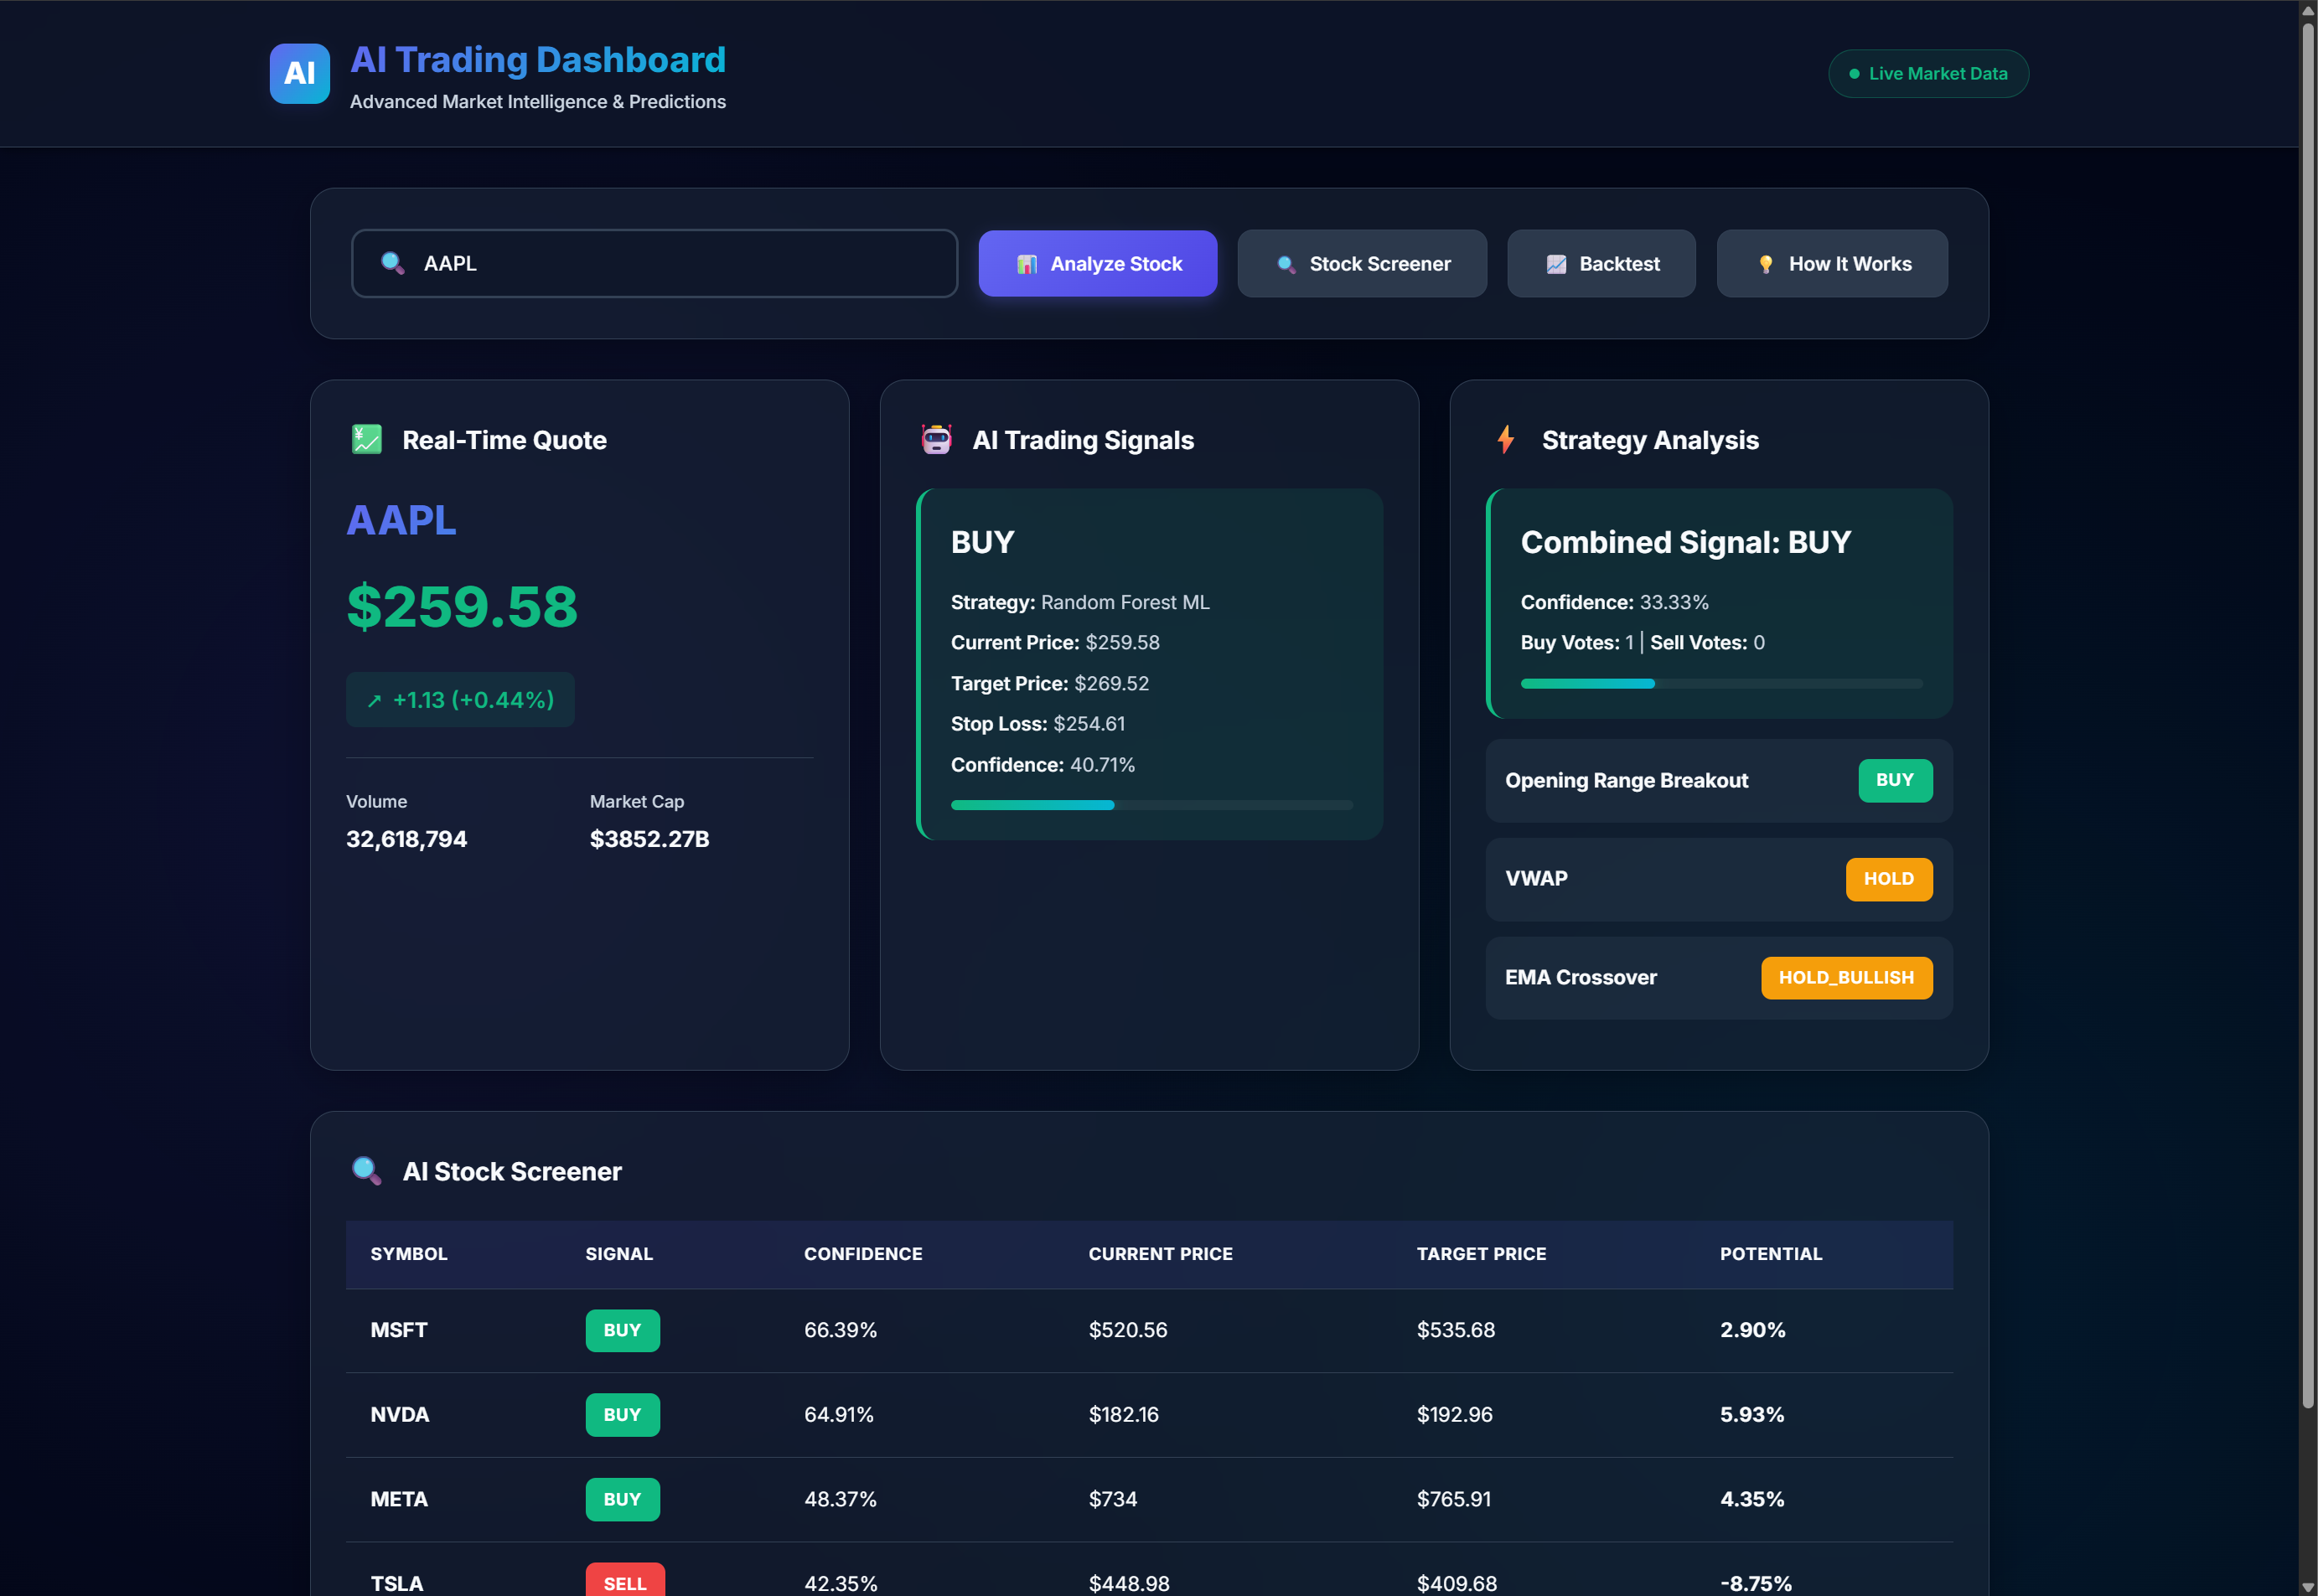
4. AI Stock Screener
Scans multiple stocks simultaneously:
- Tests a predefined list of popular stocks (AAPL, MSFT, GOOGL, AMZN, TSLA, etc.)
- Runs AI model predictions on each
- Filters for high-confidence signals (≥60%)
Displays:
- Stock symbol
- Signal type (BUY/SELL)
- Confidence score
- Current price
- Target price
- Potential gain/loss %
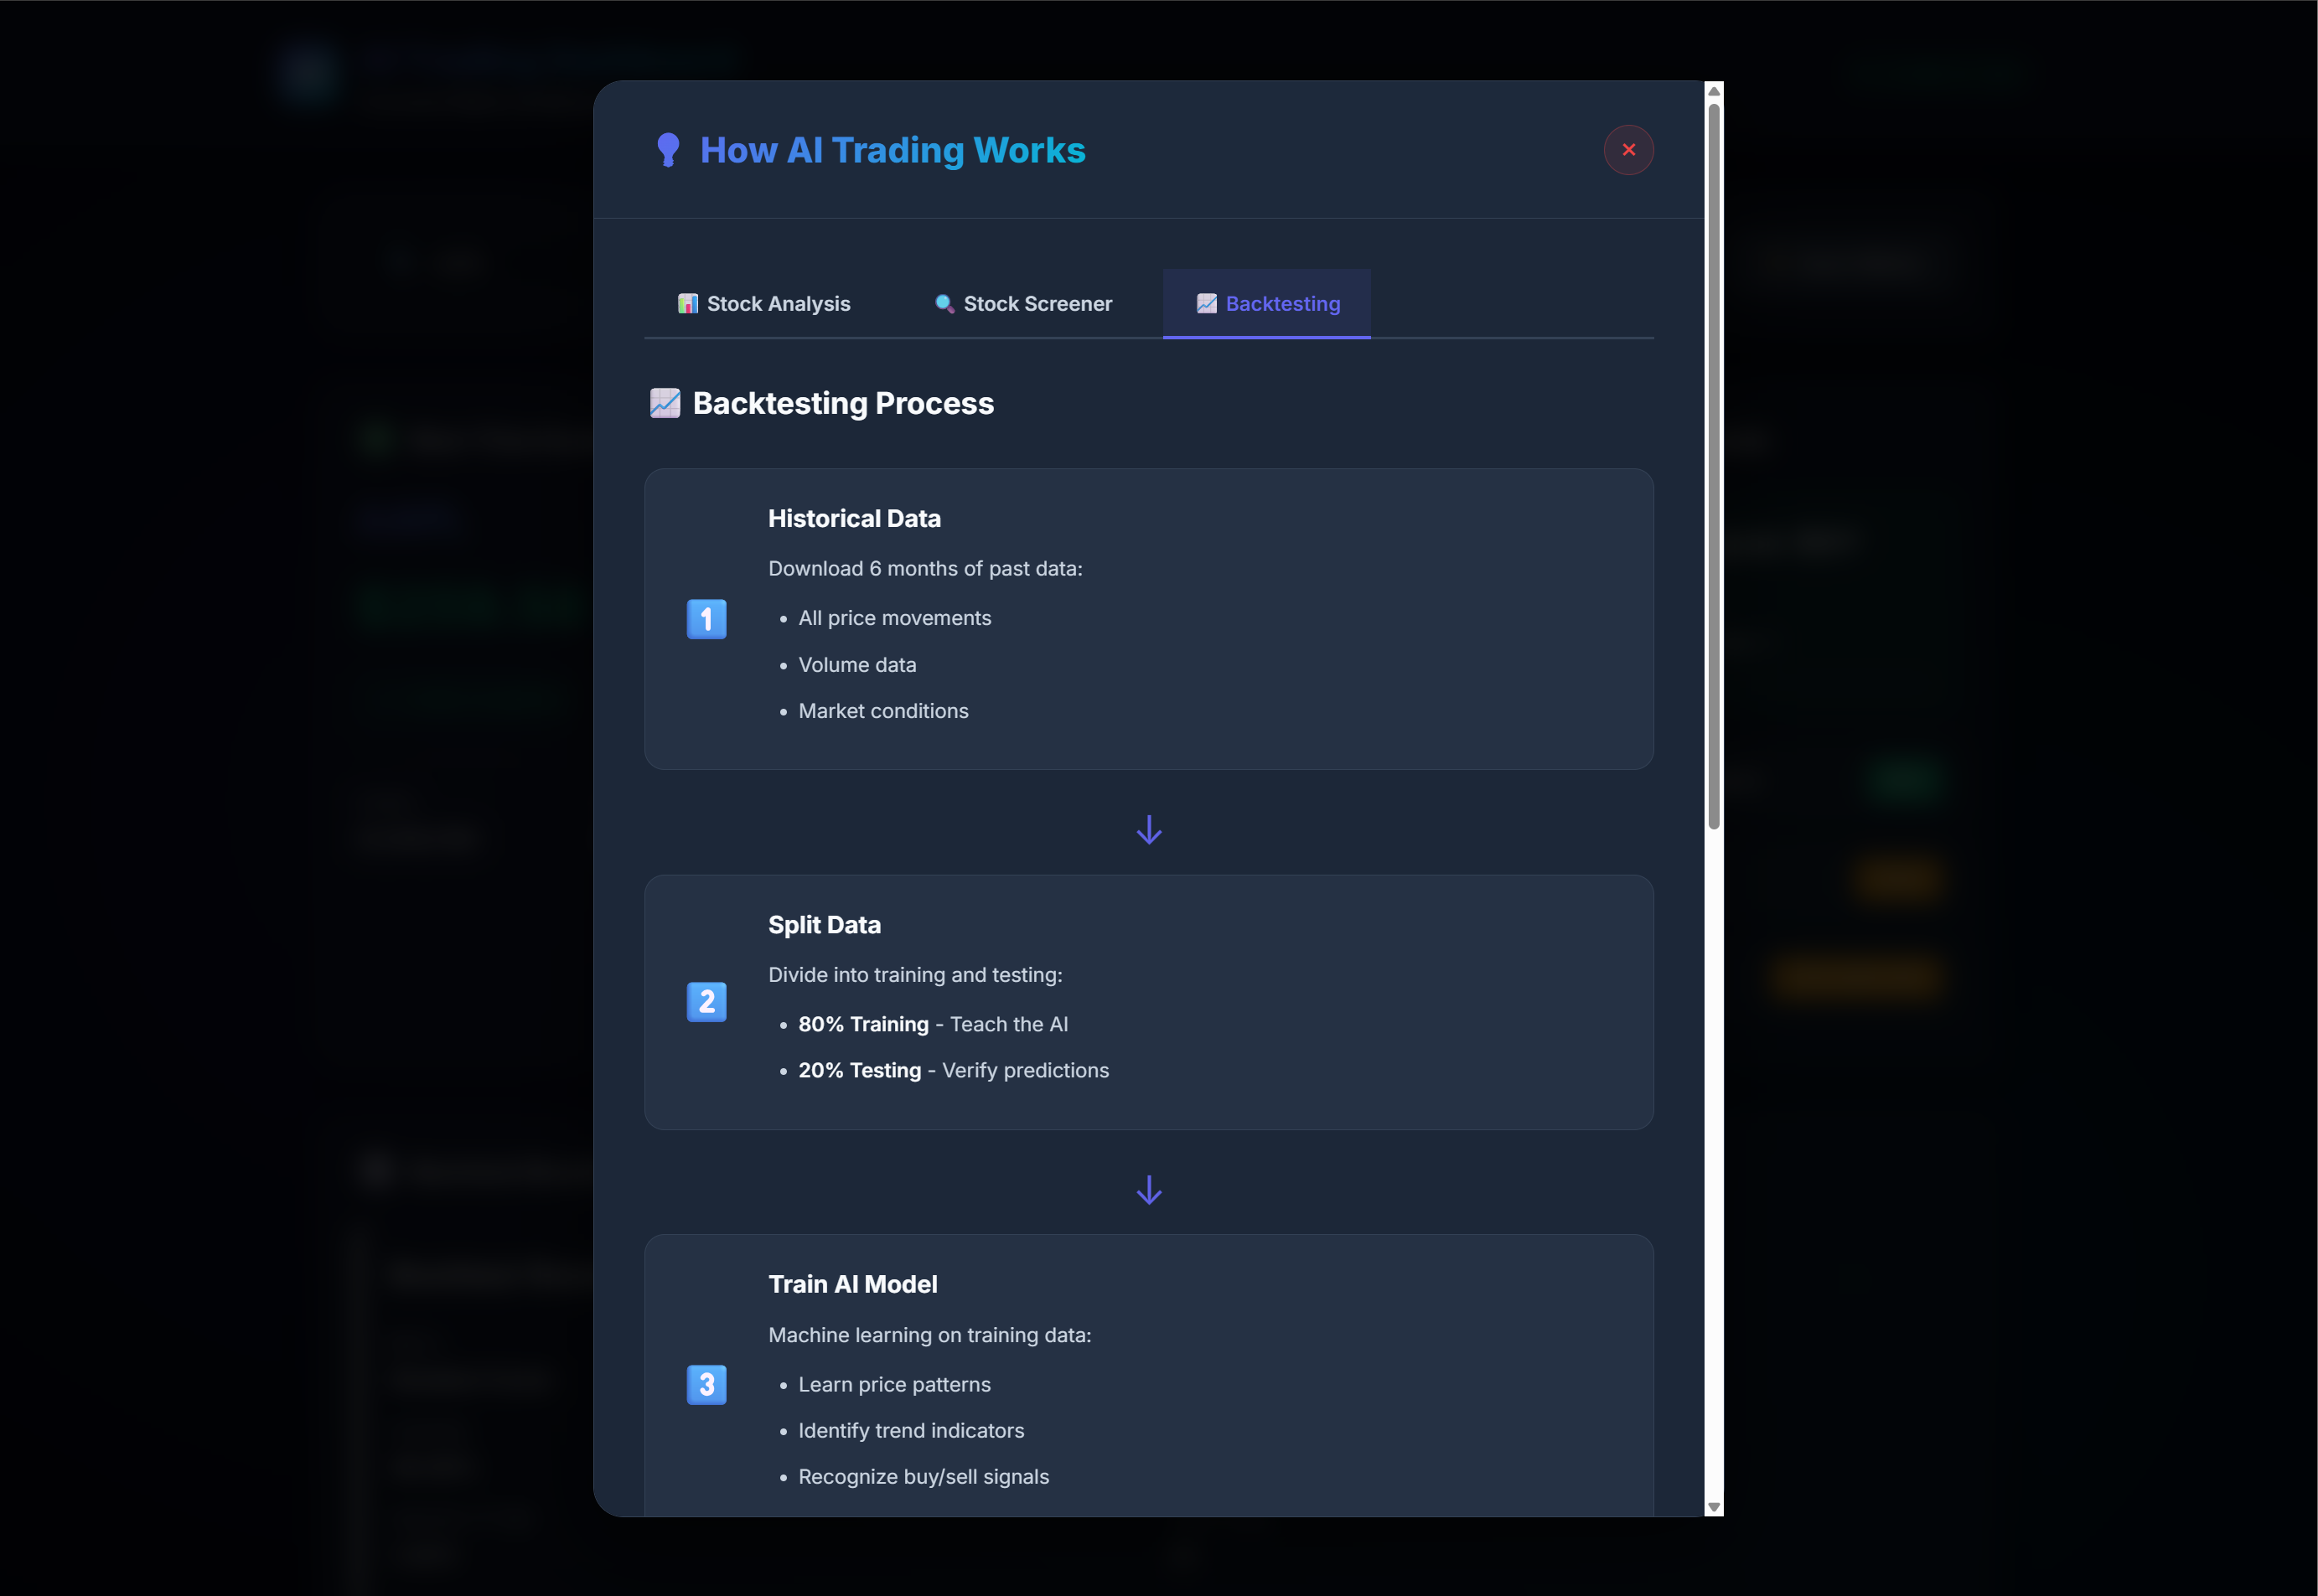
5. Historical Backtesting
Tests strategy performance on historical data:
- Period: Last 6 months
- Simulates trades based on AI predictions
Metrics:
- Accuracy: % of correct predictions
- Win Rate: % of profitable trades
- Average Return per Trade: Mean profit/loss
- Total Trades: Number of signals generated
- Model Used: Random Forest Classifier
Helps validate AI model reliability
 AI Trading